NEXUS SUITE
Powerful Tools for Powerful Design
The Nexus Suite contains powerful tools comprising a system that enables organizations to take control of every aspect of their design processes and production.
Ally ensures that modeling practices and standards are encouraged and enforced in real-time production of Revit models. The flexible rulesets can be targeted to all users, specific projects and groups based on the objects they affect or the actions of the Revit operator.
PAL (Project Activity Logger) is used to monitor, log and visualize the way an organization’s users work in Revit model. The online dashboards offer standard visualizations and with the available APIs, those interested in deeper dives or more customized reports can implement integrated BI consoles to their specifications.
CMS is a industry-leading content management system developed specifically for the AEC industry. Firms can organize, manage, set permissions and ensure the latest content is kept up to date and available for all project participants, even when working remotely. Users can find Revit, AutoCAD, PDF, images, and other file types quickly using libraries, tags, favorites, and file metadata.

Account Management
DESCRIPTION
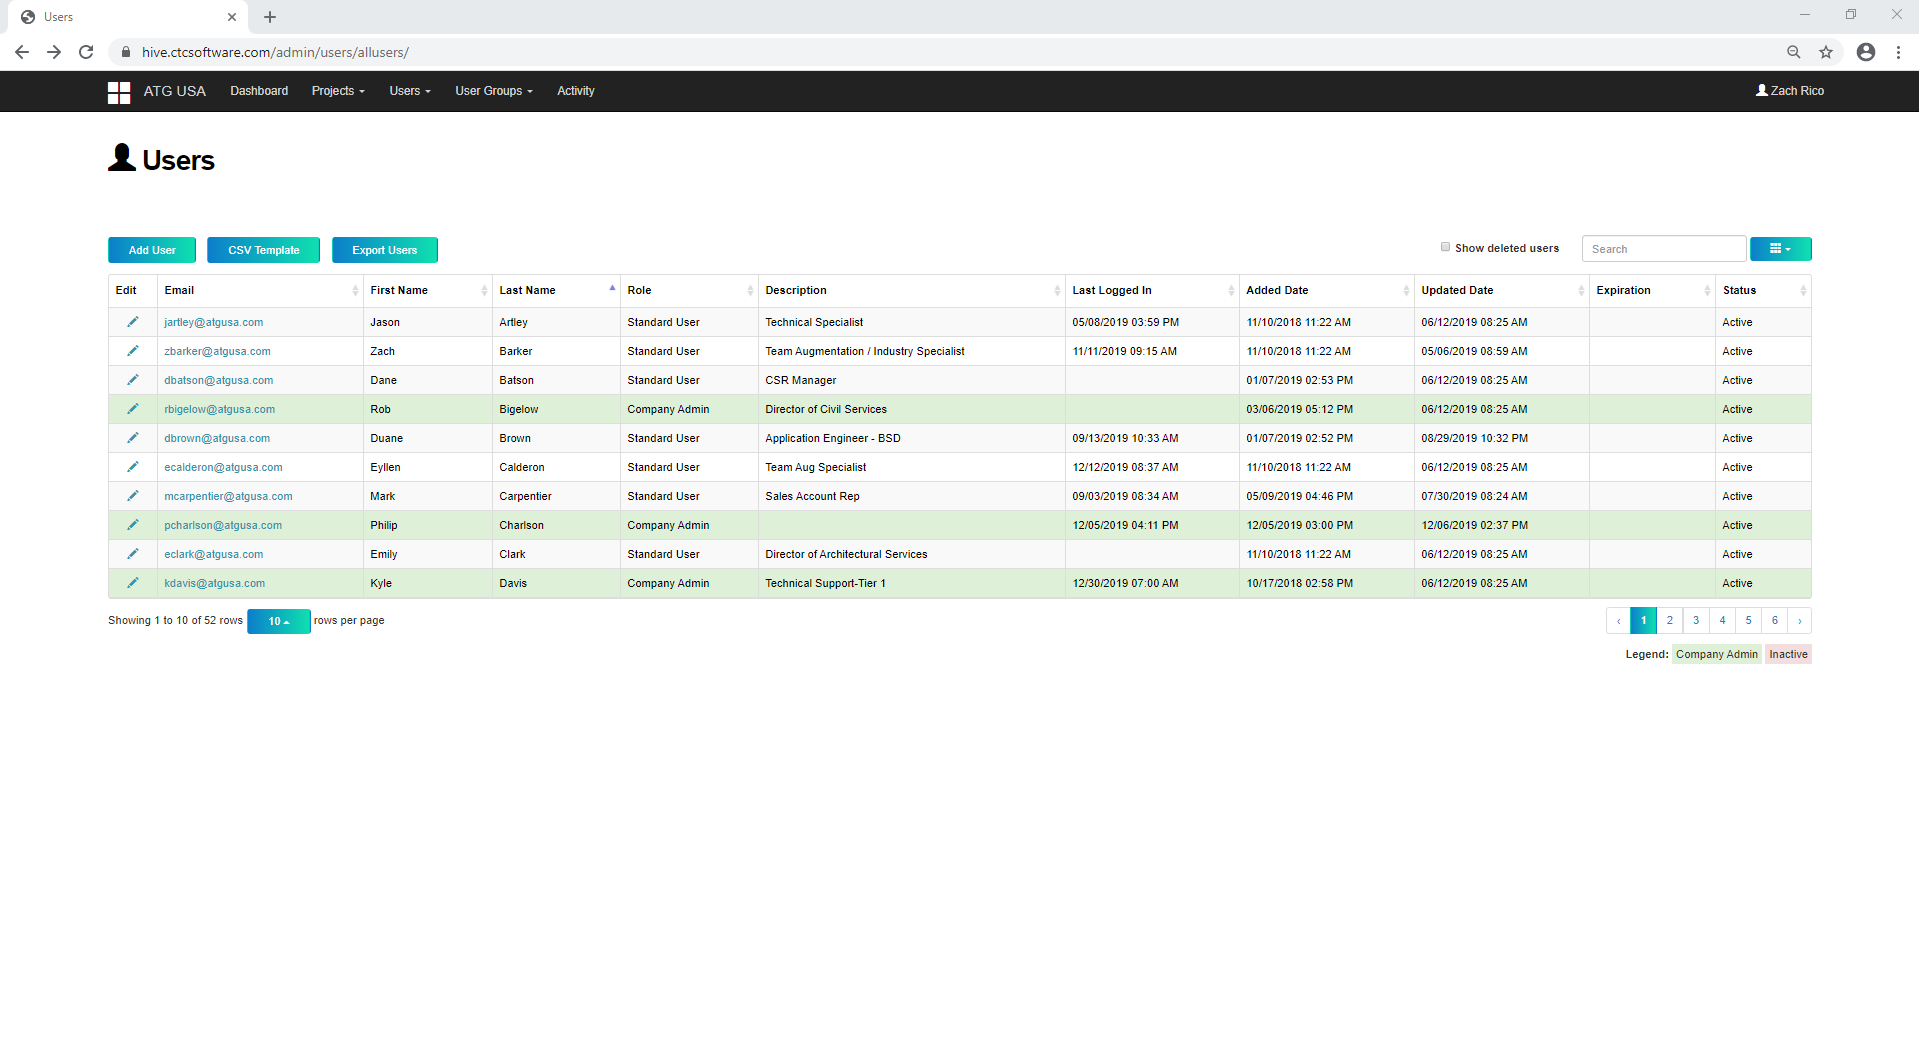
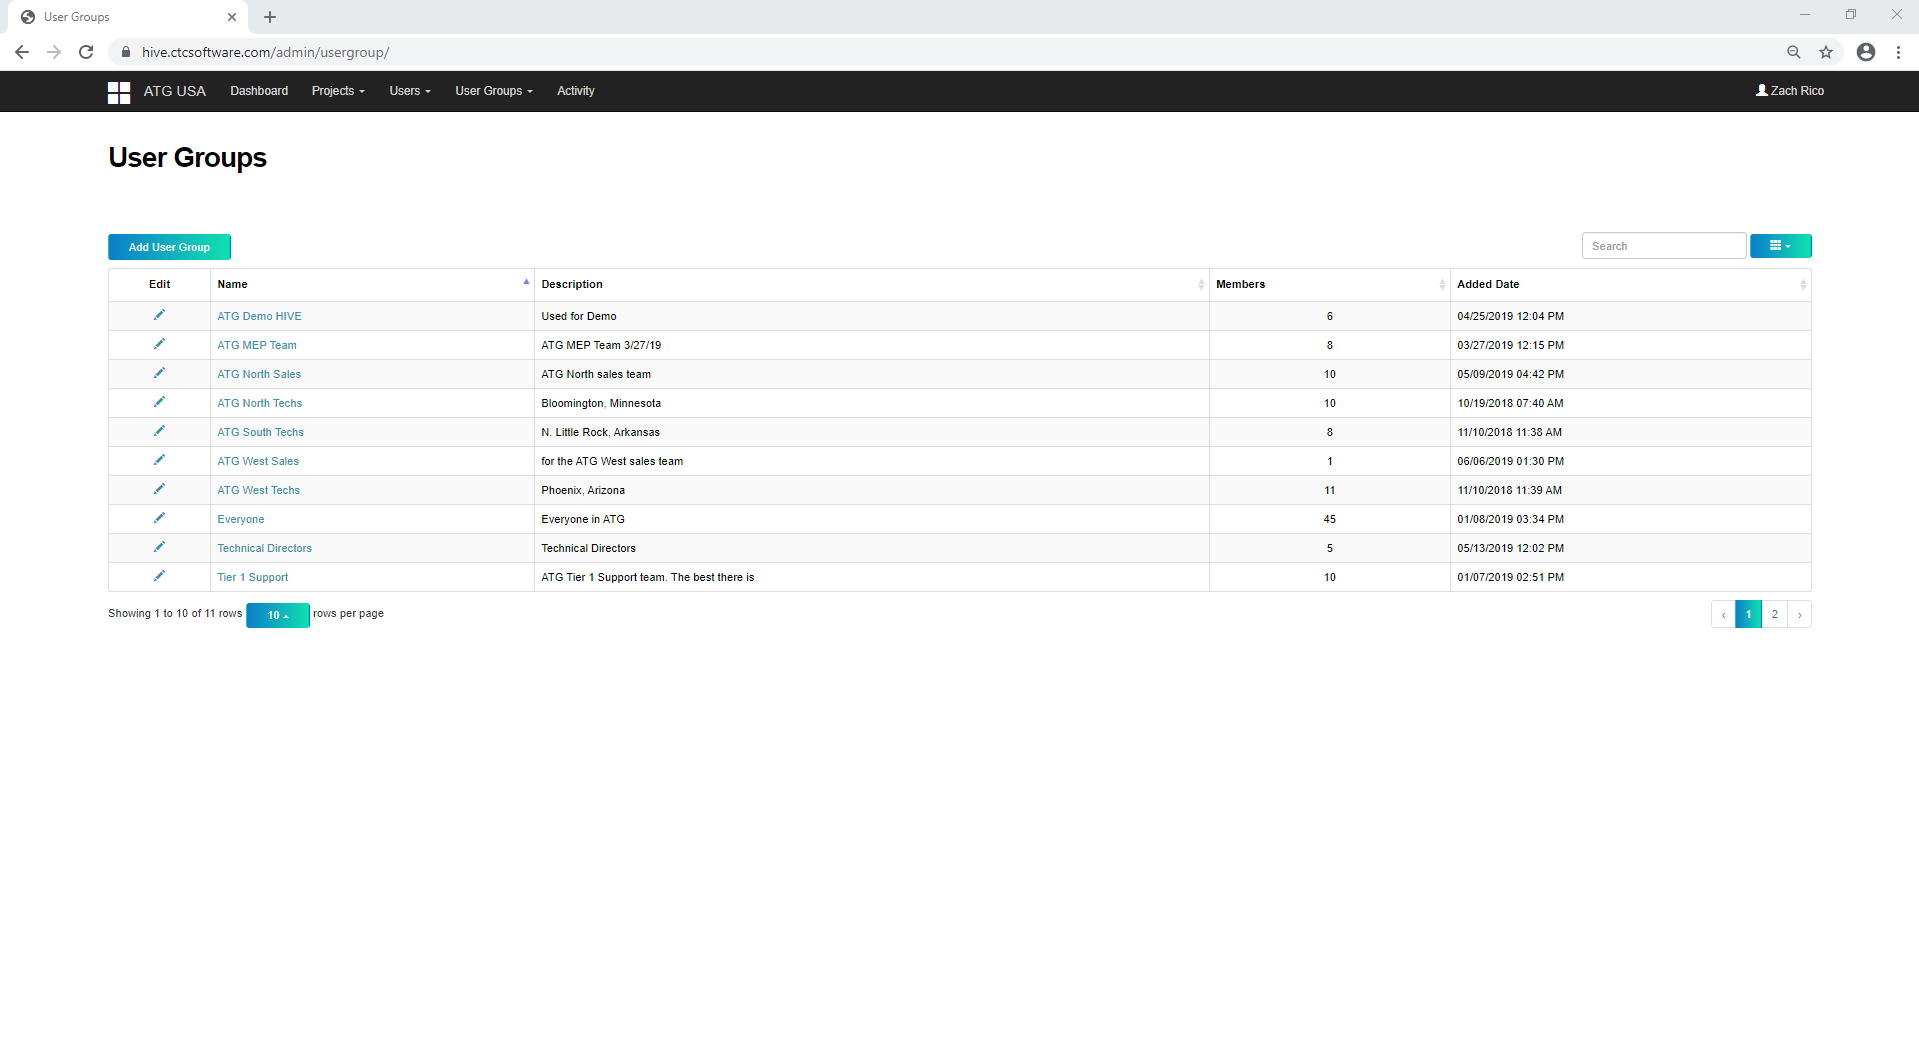
The account management portal allows company administrators to generate users along with granting access to the HIVE suite. This can be all done through any web browser allowing more flexibility for Company Admins. This also doesn’t require the HIVE application running. With this possibility managing users and adjusting permissions is a lot simpler and easier.
Some key features that are provided is User Management, Group Management, and Active Directory Synchronizer. With managing many users there is multiple options on handling these tasks. Group Management allows you to divide users in your company to specific areas instead of having everyone in each other’s way. Now with Active Directory Synchronizer adding users and managing them into groups is easy simple task that will provide its own value.
Content Browsing
DESCRIPTION
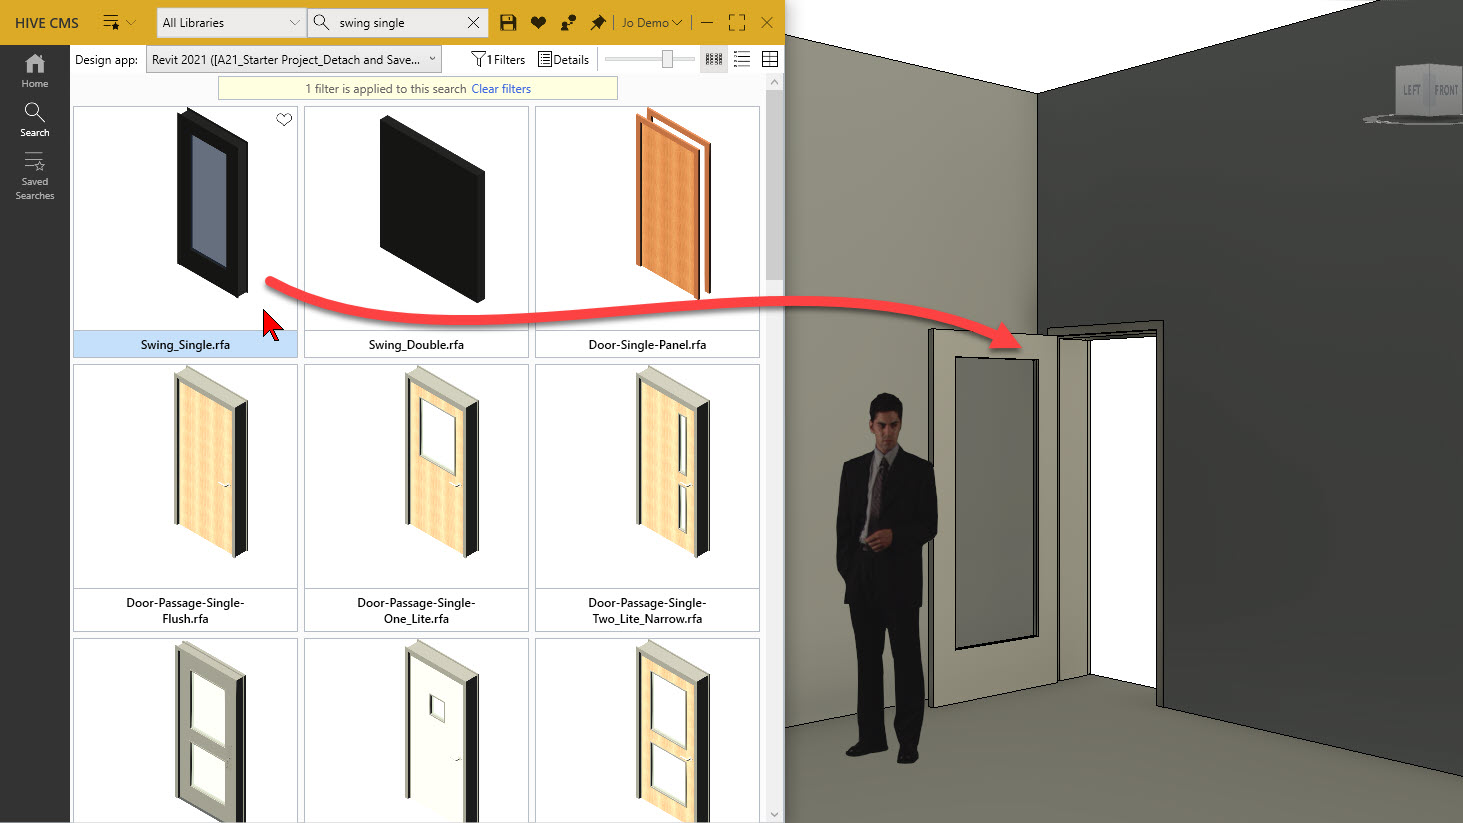
Users can quickly pull the exact content they need from HIVE and upload much more efficiently. Which means less time searching and more time being productive. With HIVE’s cloud base ability file sizes and storage sizes are no worries to you.
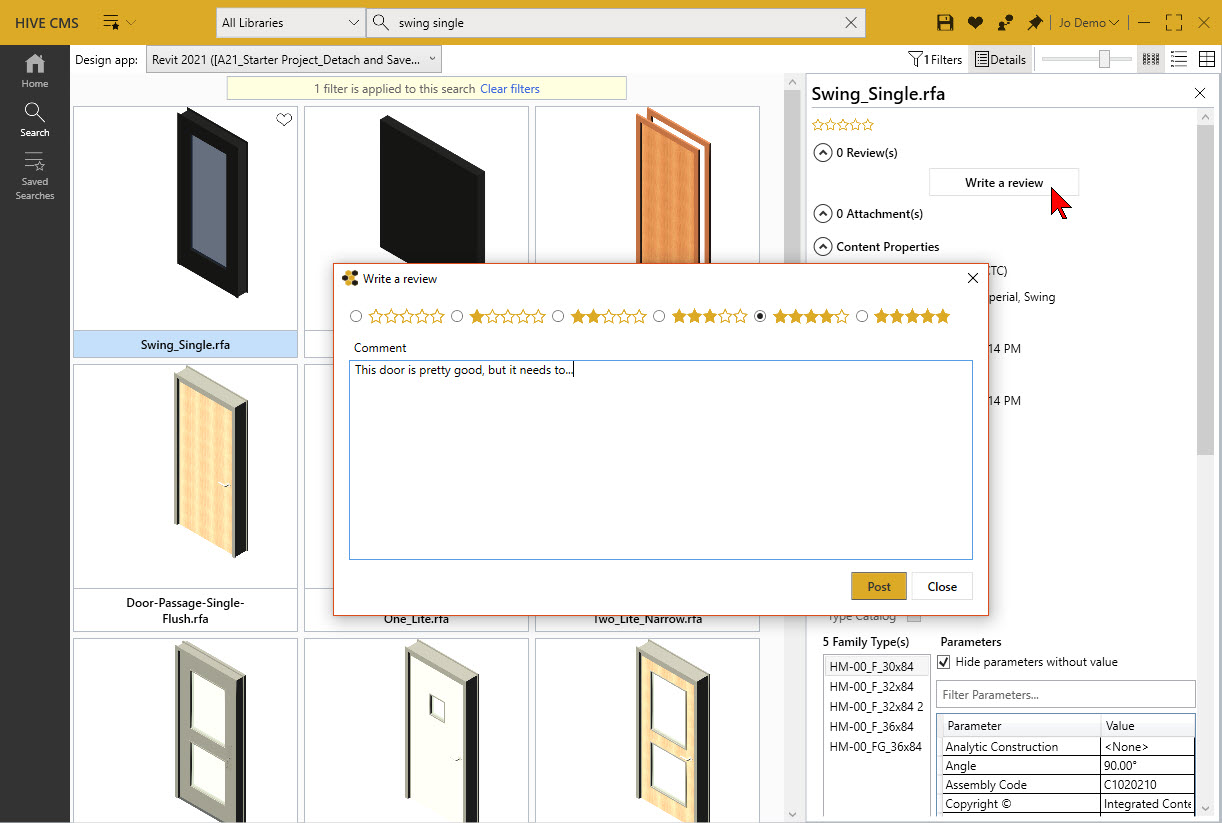
There are many key features that HIVE offers. Each one has its own distinct and unique purpose. Search and Discover both look for content, but Discover searches use parameters. Saved Searches can be set up to be user based and company based allowing users to pull content even faster. Tags allow you to filter through specific libraries and content in those libraries. Uploading content is as simple as drag and drop or even double-clicking and specifying your piece of content.
Future of HIVE – Project Activity Logger
DESCRIPTION
HIVE incorporates an optional data analytics logger for projects and content called the Project Activity Logger (PAL). This tool allows you to track data about project usage, such as how much time users are taking on different sheets, views, schedules and more. PAL will also allow you to track the health and stability of your Revit projects. Tracking all this information with PAL does not interfere with your users productivity, as they don’t even know it’s running.
Multiple reports are provided as dashboards to make quick work of understanding and navigating the data collected. Some of the reports provided include: Company Overview, Project Health, Contributor Dashboard and Team Dashboard. Each one provides different graphs to view, save and download. There are also filters to specify a targeted area in your model or project. Further, you can even create your own reports to slice and dice the data, to best suit your needs and goals.
Dashboards
The Enterprise Users Dashboard
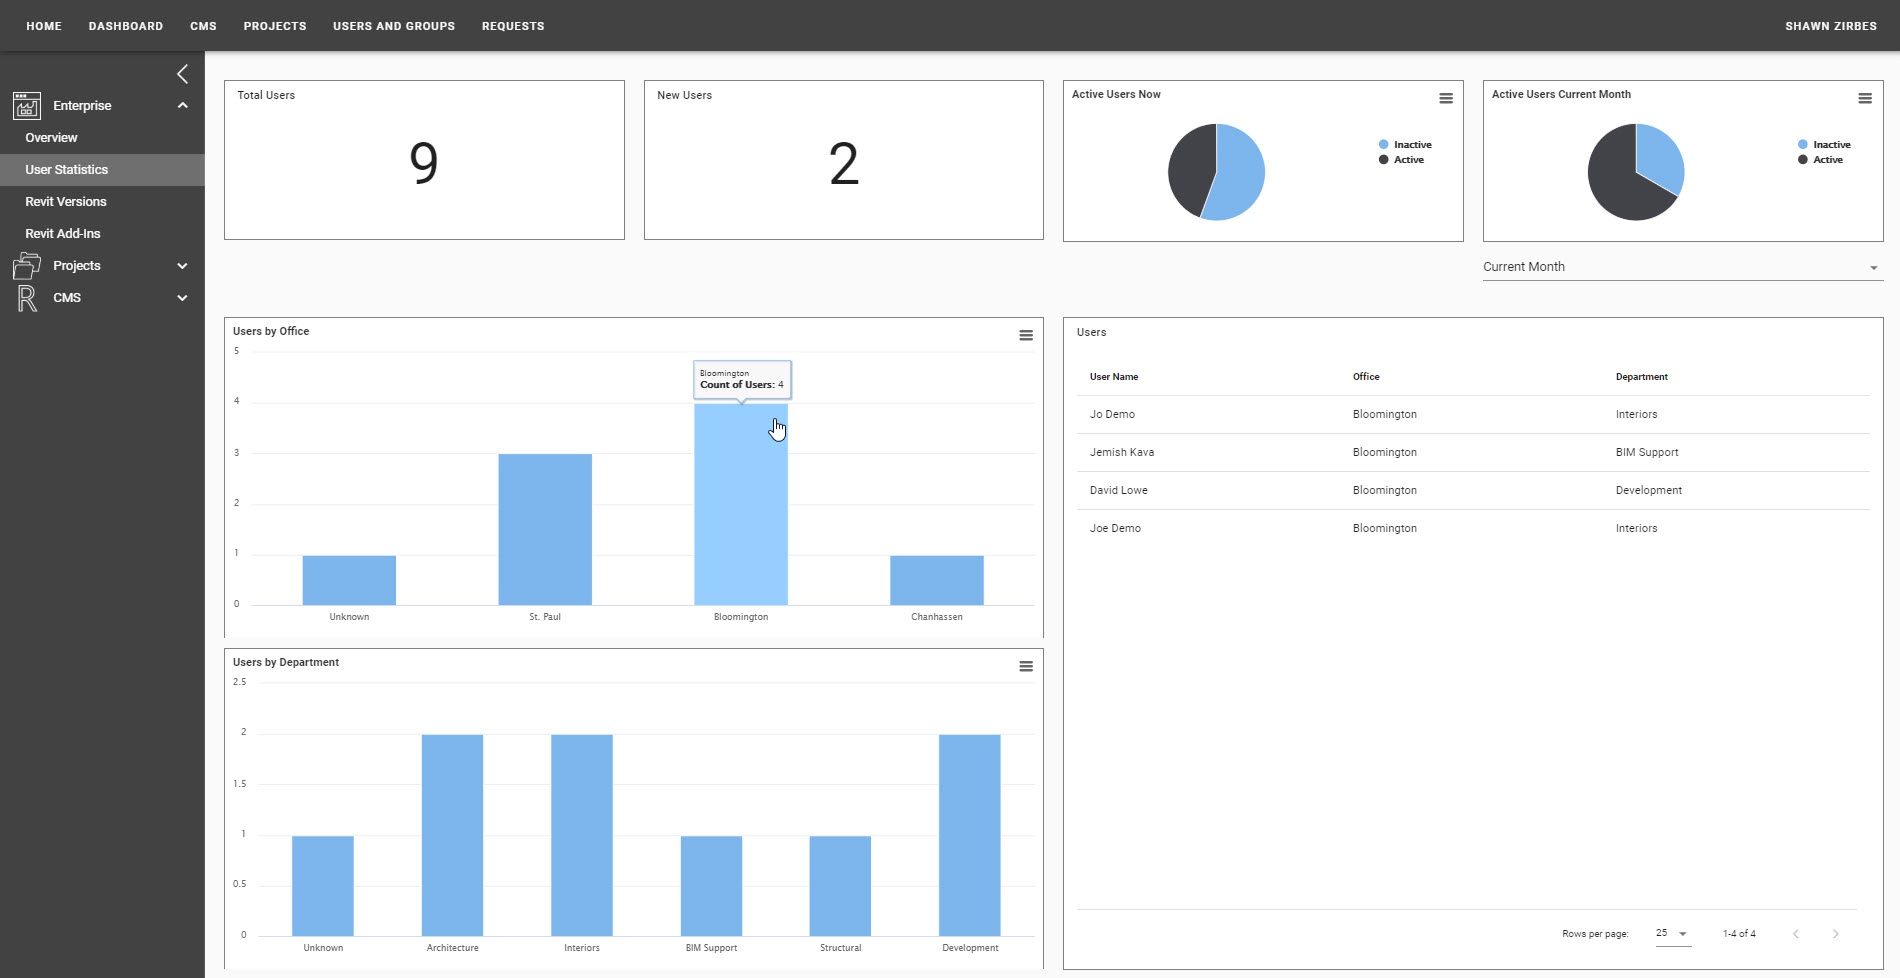
This dashboard helps managers quickly understand user activity in HIVE. Knowing where your users are assigned, and how active they are can help managers understand where user training and coaching may need to occur. This can also be a great starting point to understand licensing of HIVE across the firm.
The Revit Versions Dashboard
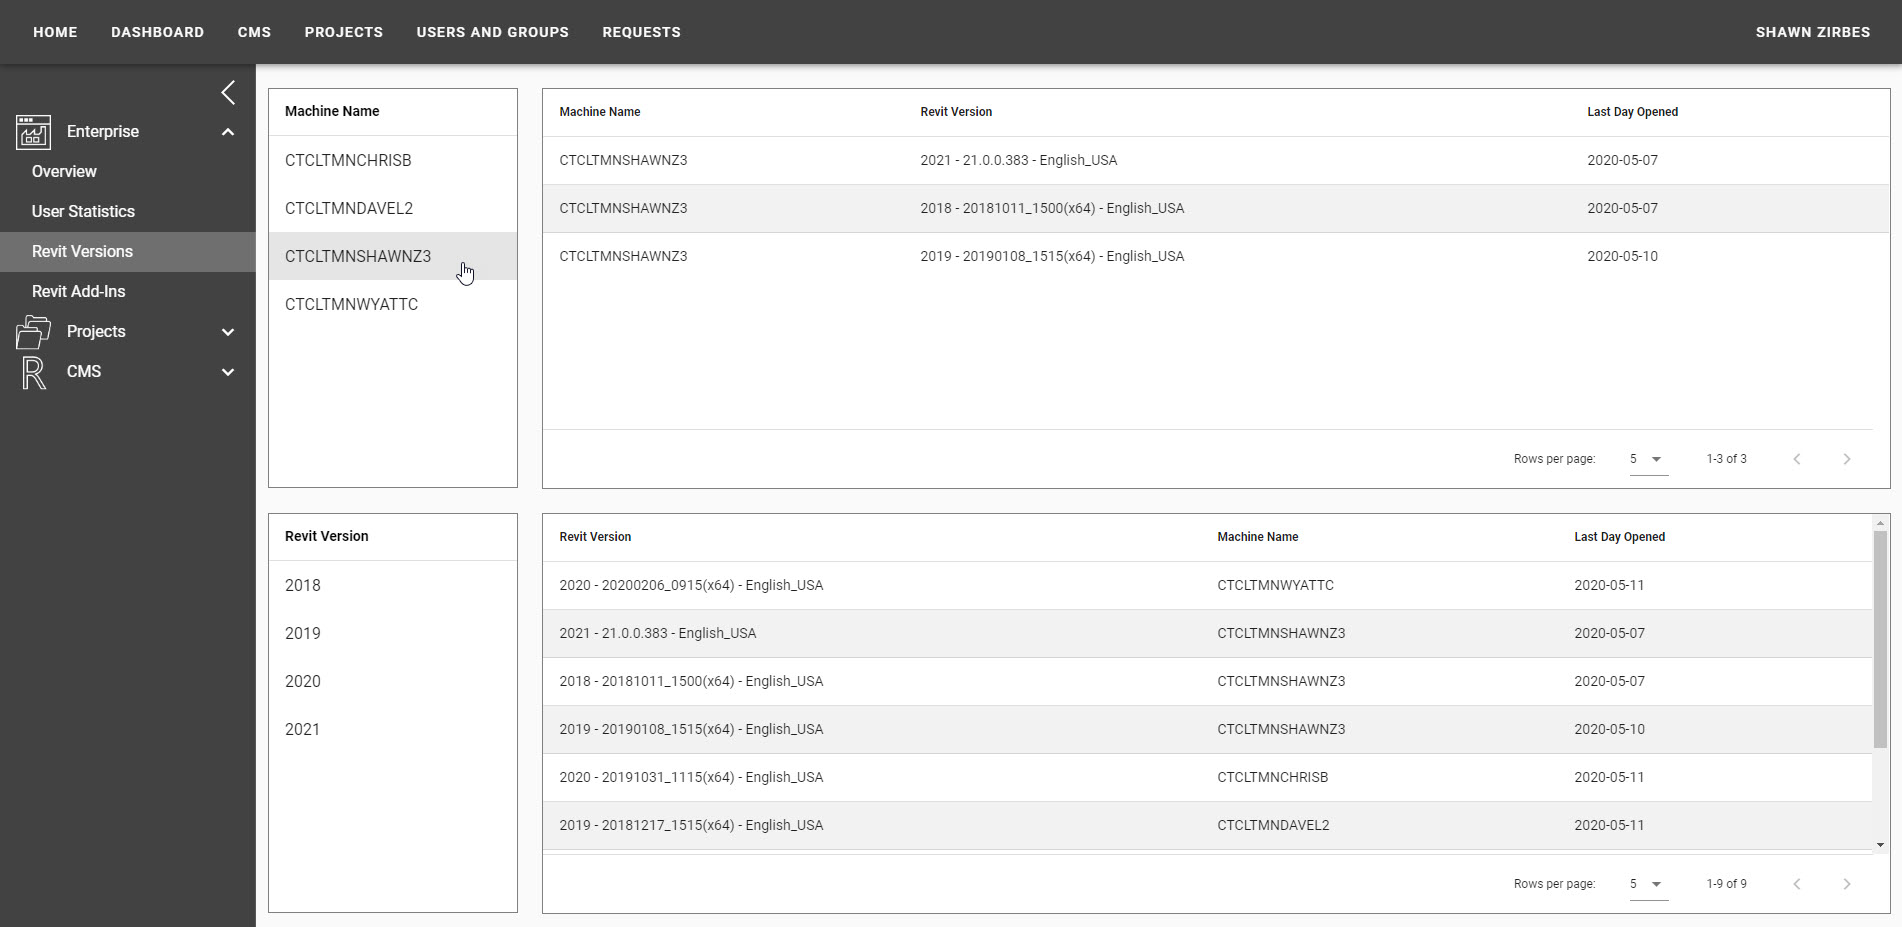
When using Revit as a design app in the firm, it is important to know where updates have been applied and where they have not. Working on Revit models across multiple updates on the same Revit version is asking for project model crashing to manifest. This dashboard can help BIM Managers understand exactly who is using Revit and what version is installed.
The Project Overview Dashboard
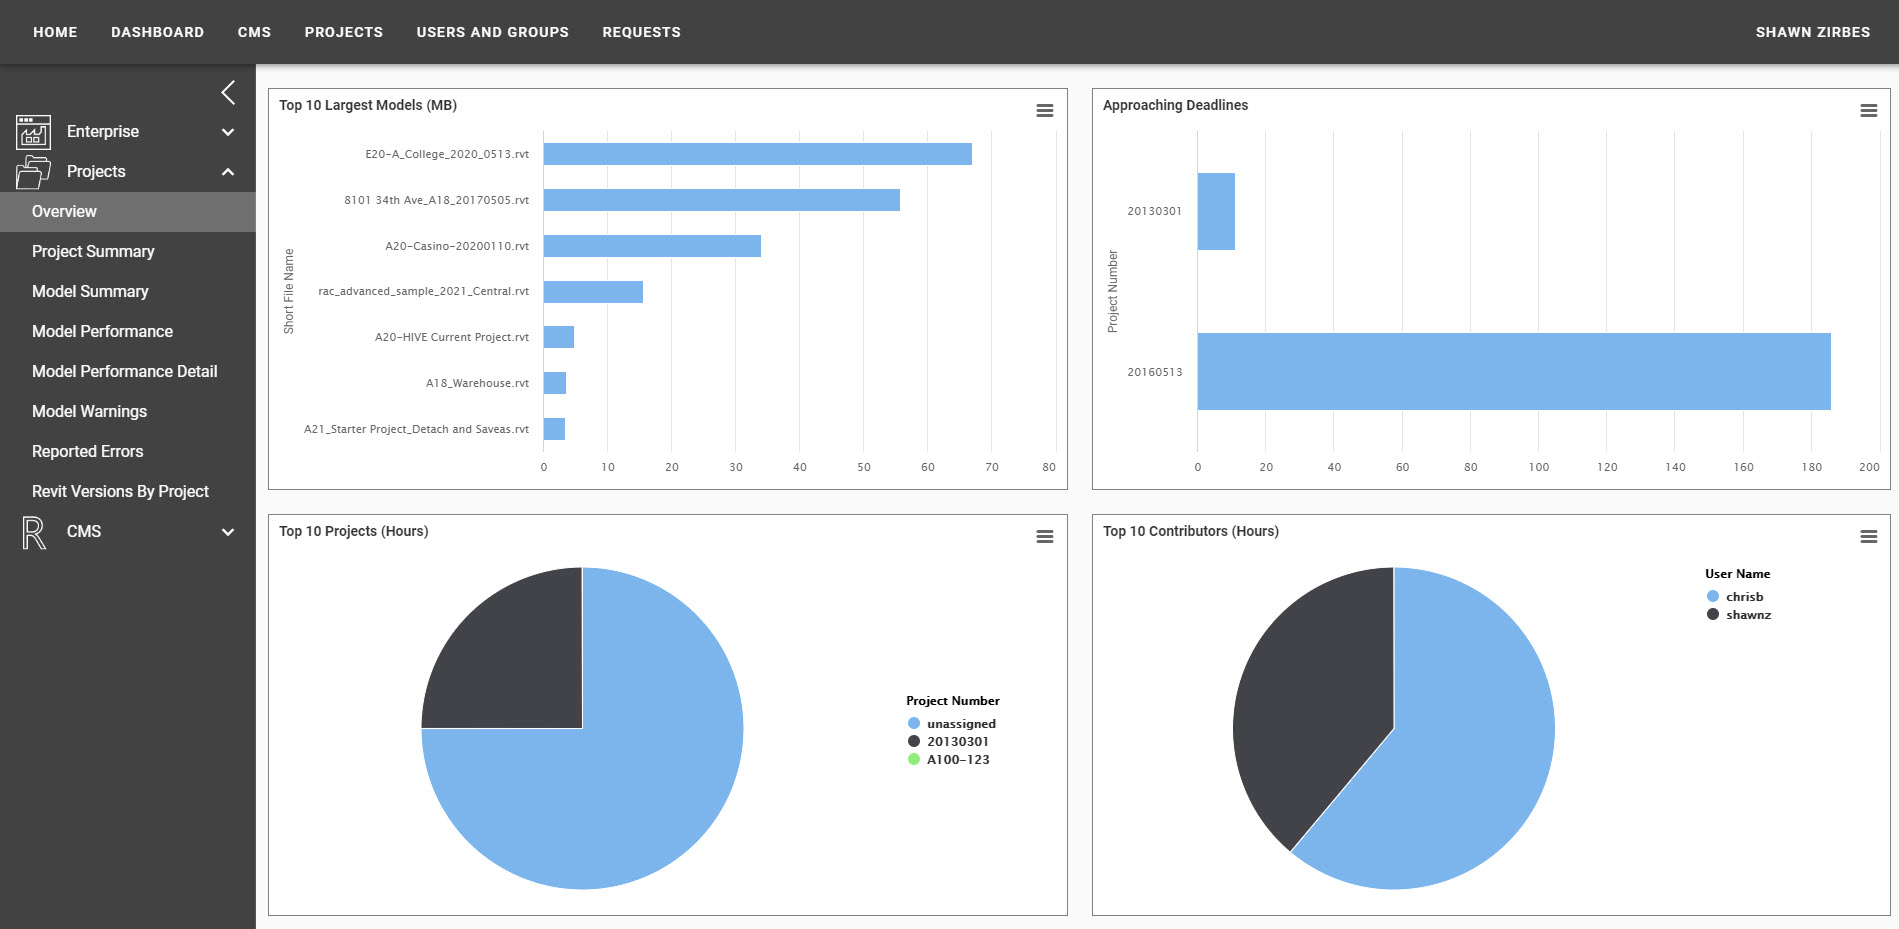
Insight into corporate projects can assist BIM Managers in decision making. Is there an outlier project that has grown unexpectedly in size? Which models are opening very slowly? Is there a project very close to deadline? Knowing this helps us allocate our time to ensure the BIM environment runs smoothly.
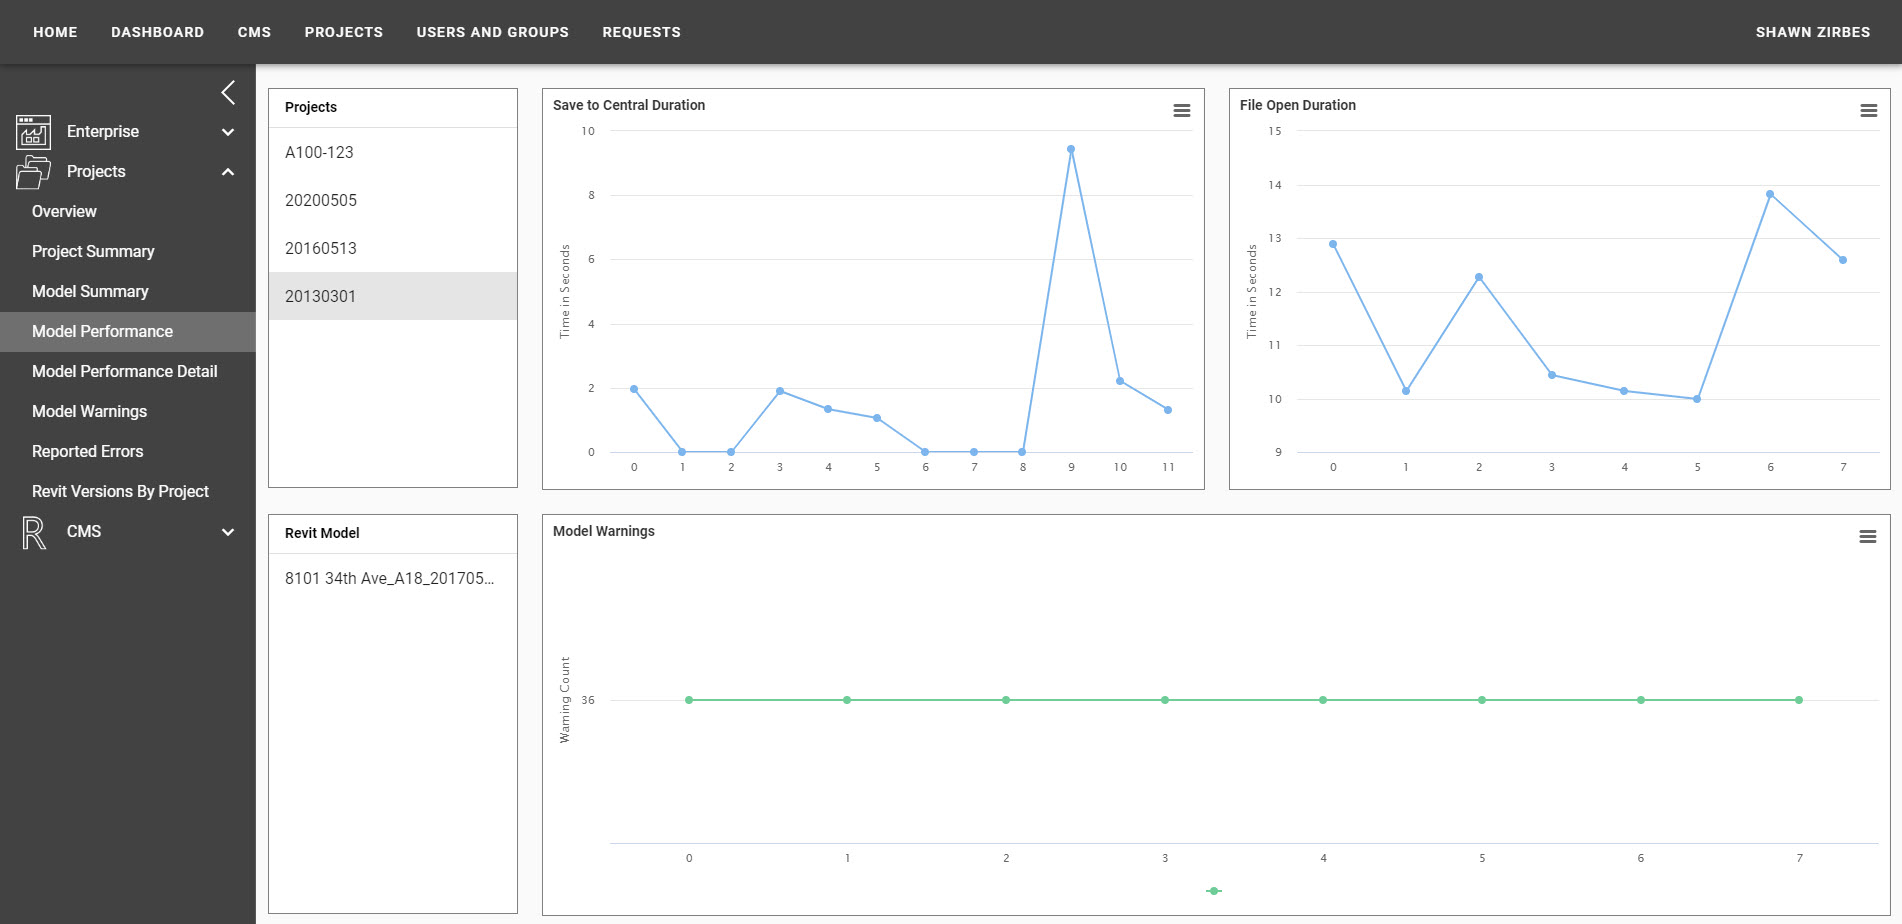
The Model Performance Dashboard
When you need to dig deep into project performance issues, the most important things to know immediately is open time, save time and warning counts. After that, we can begin to understand which specific models need attention, and perhaps even what we may need to do. These 3 metrics can be easy early indicators of issues that may occur in a model. Knowing this as a BIM Manager makes it easy to act before the users are sitting stagnant because the model has already crashed.
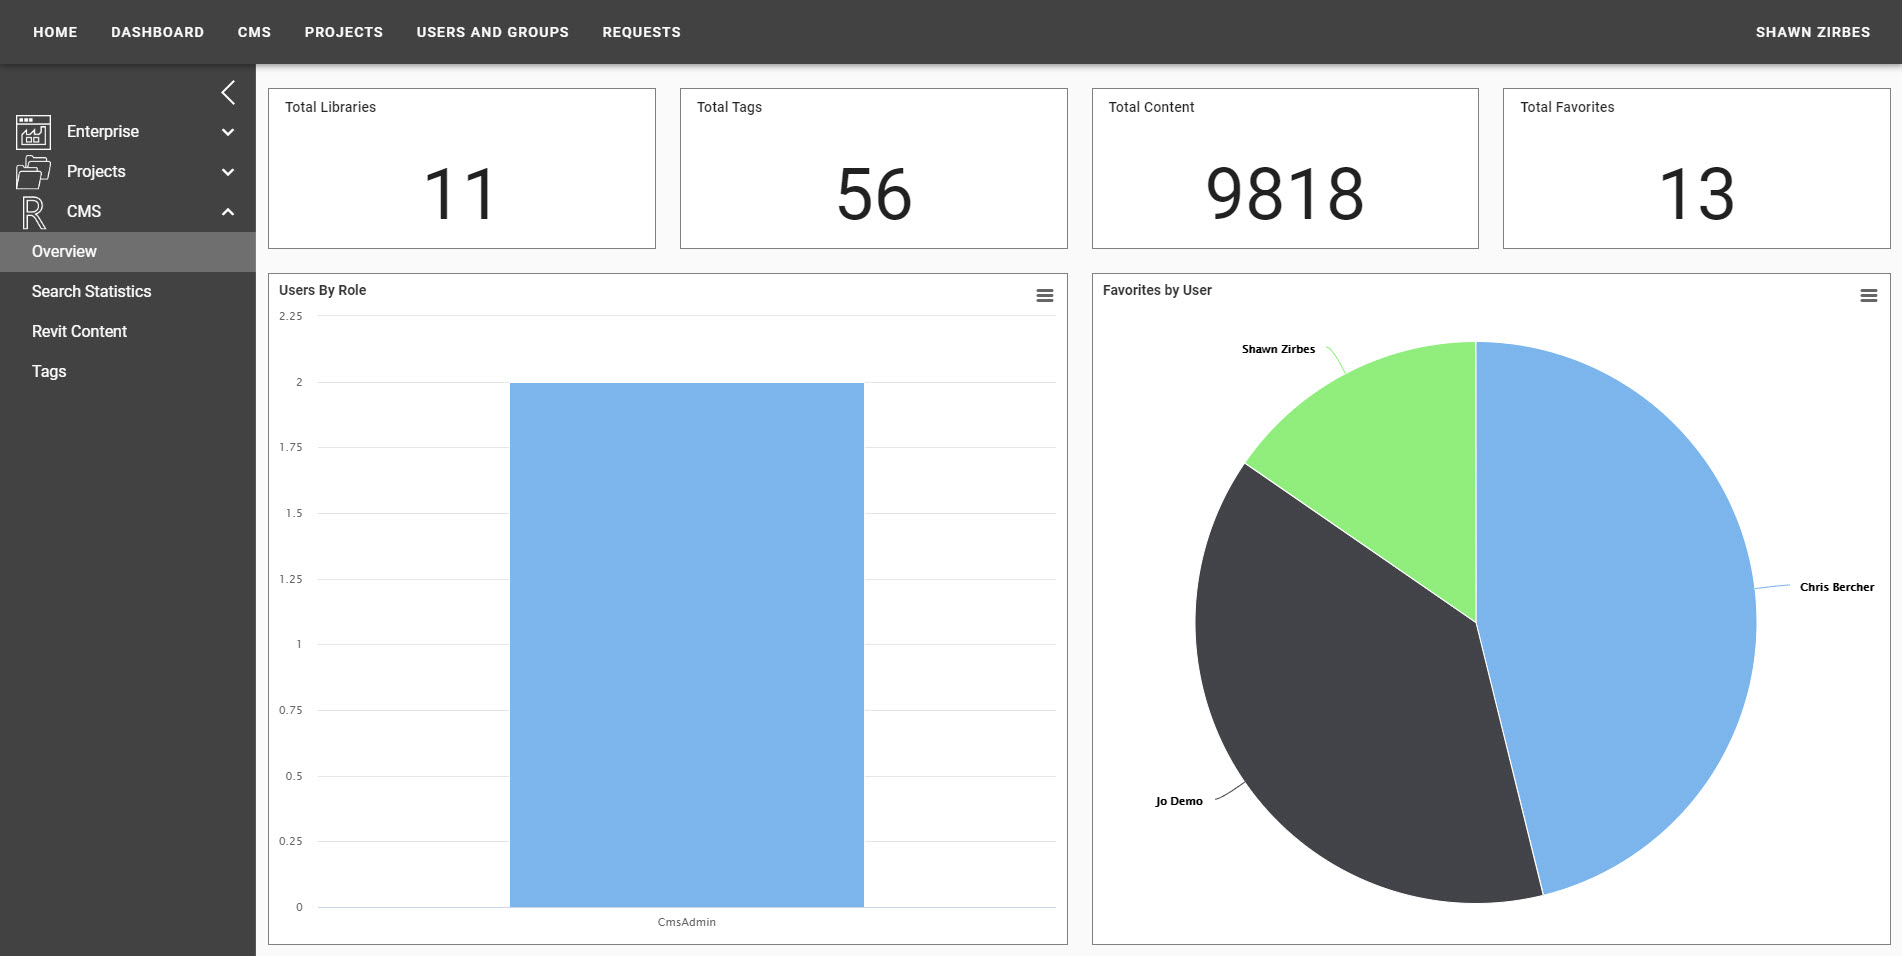
The CMS Overview Dashboard
When managing your libraries, it is a good plan to get a general understanding of who is there. This overview dashboard provides some general numbers about how many libraries, tags, pieces of content and favorites exist in your organization. The other CMS reports provide more insight into these baseline metrics.
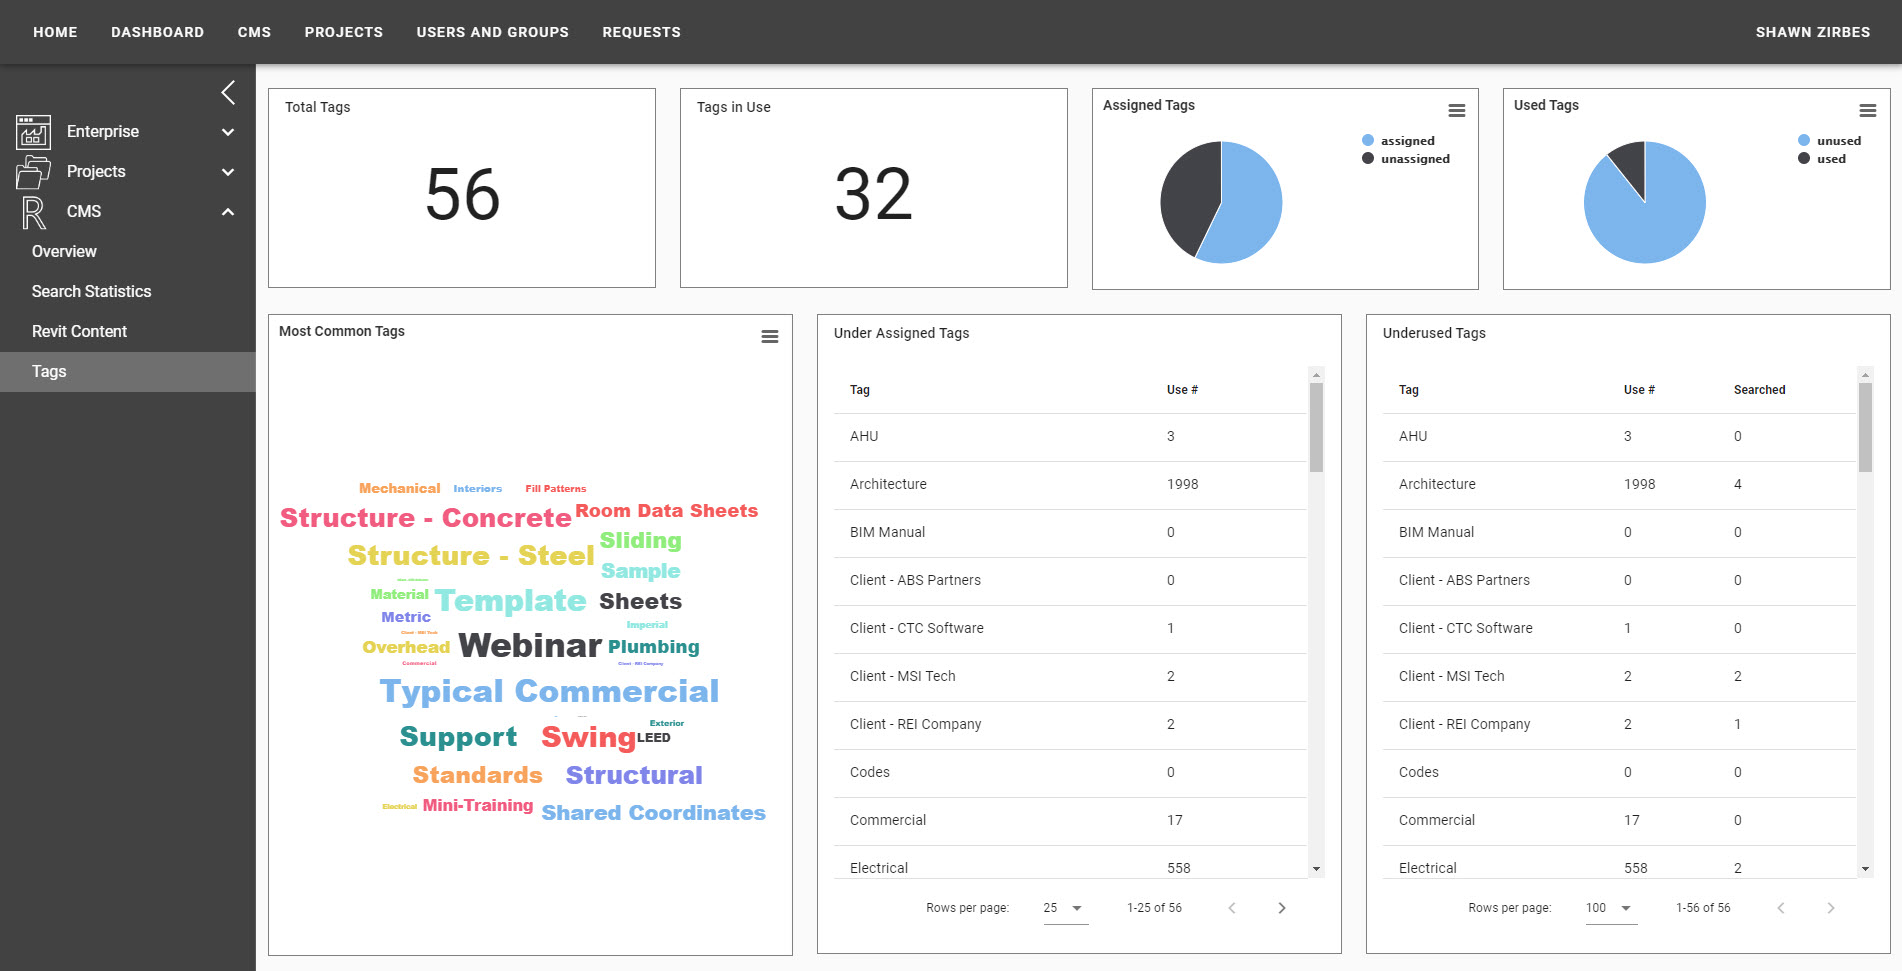
The Search Statistics Dashboard
How is HIVE being searched? How are users navigating? When are they using the CMS? This dashboard provides all the insights about general searching within the HIVE CMS. Isolate users and see their specific interactions with HIVE. Understanding this can often lead to improvements in content, making the users even more pleased with the browsing experience.
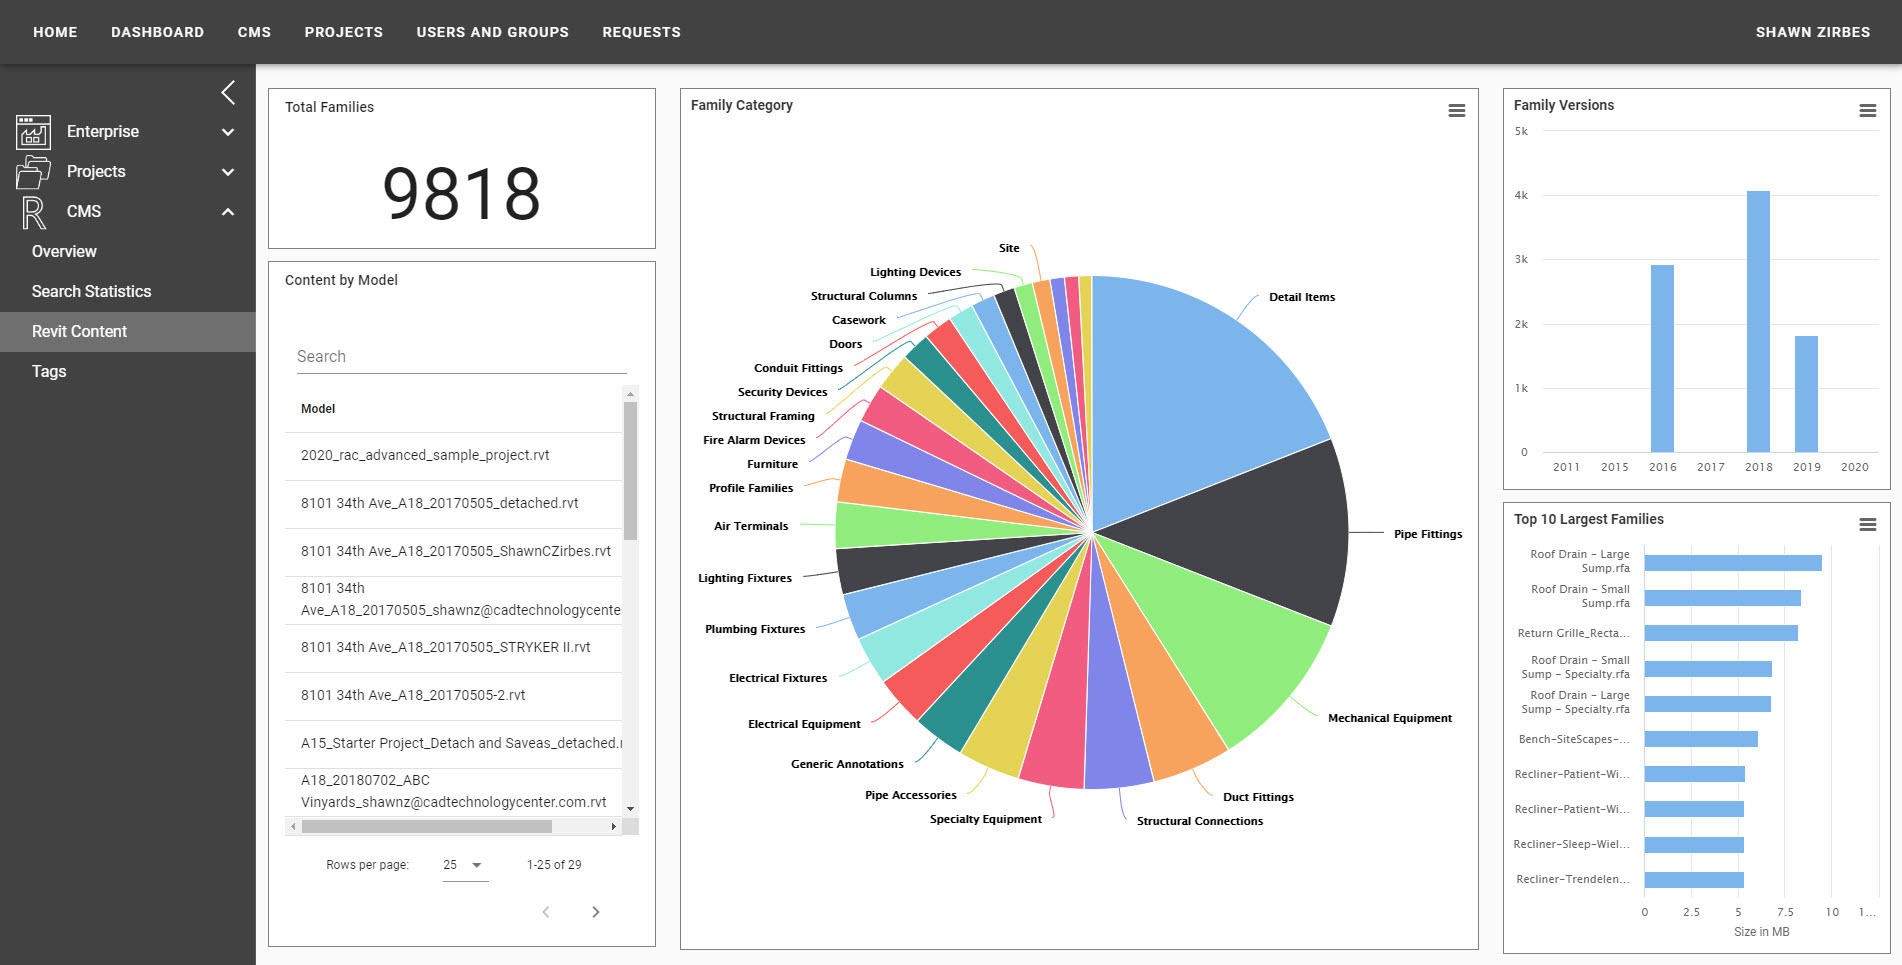
The Revit Content Dashboard
How is Revit content spread across your firm? Do we really know how large our family content is, and where it is being used? This dashboard explains just that. Understand version and category breakdowns. Dig into recent models to understand what families have been placed from HIVE and to derive what families have not been placed from HIVE.
